Showing posts with label Global Warming. Show all posts

2022-09-12

Grief and Gardening: Index

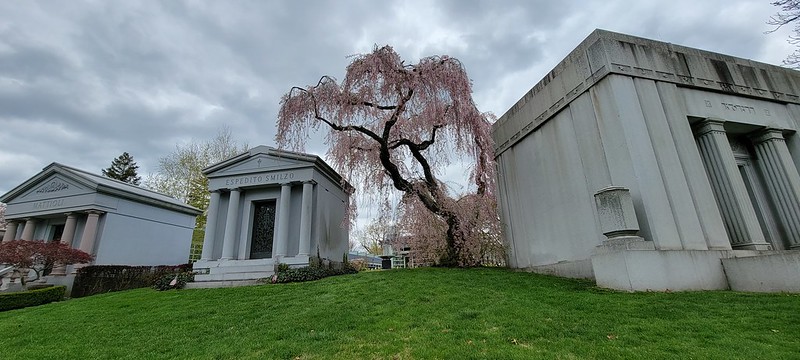
Green-Wood Cemetery, Brooklyn, NY, April 2021
Next Tuesday, September 20th, I will be the guest speaker for Green-Wood Cemetery's Death Cafe. Next week is also Climate Week; the topic is "Grief and Gardening", that title taken from the long-running series of blog posts here.

Listed below are my related blog posts, grouped by topic. For now, I'm omitting all the eulogies and remembrances for the deaths of family, friends, and pets.

Grief and Gardening: Ashes (Remembrance Day for Lost Species), published 2019-12-02, is one of my favorite writings on the subject of grief. It weaves together nearly all the topics below.

Biodiversity Loss

2011-01-08

Sustainability Guidelines for NYC Parks

Panorama, Frozen Lullwater at Prospect Park at Sunset
Panorama, Frozen Lullwater at Sunset, Prospect Park

The New York City Department of Parks and Recreation (Parks) recently released new sustainability guidelines for the design and maintenance of NYC's green spaces, High Performance Landscape Guidelines: 21st Century Parks for NYC:
High Performance Landscape Guidelines is the first document of its kind in the nation: a comprehensive, municipal design primer for sustainable parks and open space. The product of a unique partnership between the Parks Department and the Design Trust, a nonprofit organization that helped create sustainable guidelines for NYC buildings, High Performance Landscape Guidelines covers every aspect of creating sustainable parks, from design to construction to maintenance, and feature many best practices for managing soil, water, and vegetation resources.
- Press Release, January 6, 2011
The Guidelines, running over 270 pages, cover site assessment; design, construction and maintenance; and soils, water and vegetation. the final section of the manual includes several case studies, including two of Brooklyn's Parks: Calvert Vaux and Canarsie Parks.

Climate change is identified as a major factor, if not the single most important consideration, for the guidelines:
Climate change threatens the stability and longevity of New York City’s infrastructure, buildings, and parks; it also compromises the health and safety of the city’s population. Unless the growth of greenhouse gas emissions is curbed and reversed, experts predict that climate change will result in significant sea level rise, increased storm intensity and frequency, and increased temperatures.

Two factors will exacerbate the impacts of climate change in New York City: the urban heat island effect and the city’s overburdened stormwater infrastructure.

- Climate Change and 21st Century Parks, Part 1, Guidelines
[goog.gl]

Related Content

Sustainable Gardening
Parks
Sustainability

Links

High Performance Landscape Guidelines: 21st Century Parks for NYC, available as PDF (273 pages)
Parks Press Release: A New Year Launches A New Era In Great Park Design, 2011-01-06

2009-10-15

Trees for the Future, Blog Action Day 2009

Like Garden Rant, global warming and climate change is a recurring topic on this blog:
The impacts of climate change to urban areas, such as New York City, will be extreme. Today, a typical NYC summer has 15 days with temperatures over 90F, and 2 days over 100F. By the end of this century, even optimistic scenarios, in which we reduce emissions and greenhouse gases starting NOW, NYC will have 39 90F days, and 7 100F days. In a typical summer. Some summers will be worse. People will die. If we do nothing, it will be worse.

I've written a lot about more immediate benefits of city trees, such as reduced flooding, summer cooling, and improved air quality. There remain opportunities for nurturing our urban forests. Addressing climate change is one more reason to do so:
Urban trees help offset climate change by capturing atmospheric carbon dioxide in their tissue, reducing energy used by buildings, and reducing carbon dioxide emissions from fossil-fuel based power plants. Our City’s trees store about 1.35 million tons of carbon valued at $24.9 million. In addition, our trees remove over 42,000 tons of carbon each year.
- Benefits of NYC's Urban Forest, MillionTreesNYC
Planting trees is one thing a gardener can do that will outlive them. But what world will my tree grow into? And what are its chances for survival in that world? I must avoid trees that are already at the southern limit of their range in NYC; by the end of the century, the climate will have escaped them. Trees can't move fast enough to keep pace with the changes that are coming, that are already happening. They will need our help to survive.
I feel compelled to act as a guardian of my little area of the world, for as long as it, and I, last. Though I have always had, and expect I always will have, a troubled relationship with "community," perhaps there is one I can be part of which will "watch over a much larger area." It is my belief, my hope, that collectively we will create, and find in each other, that community.
- July 26, 2006: The Bemidji Statement On Seventh Generation Guardianship
The whole world is now our Ark, and we are its Noah. It's going to be a long ride.

2008-02-12

New York invests in California's carbon

US carbon asset manager Natsource LLC said on Monday it has invested in the first forest-based greenhouse gas emissions reductions under California rules. Natsource paid a private owner of a redwood forest in Humboldt County represented by nonprofit group the Pacific Forest Trust for credits representing 60,000 tonnes of carbon emissions. - NY Company Buys First Californian Forest Carbon Credits, PlanetArk
The emissions reductions were created through sustainable forestry on a permanently conserved property in California. This deal illustrates the significant role that management of existing forests can play in addressing climate change. The transaction is the first commercial delivery of certified emissions reductions under the Forest Protocols adopted last fall by the California Air Resources Board (CARB). The Protocols are the first rigorous governmental accounting standards in the U.S. for climate projects embracing forest management and avoided deforestation, while ensuring emissions reductions are real, permanent, additional and verifiable. - Joint Press Release (PDF), NatSource and Pacific Forest trust

Links

California Air Resources Board (CARB) NatSource Asset Management LLC (NatSource) The Pacific Forest Trust

2008-01-16

It's too late, but it's not too late, is it?

The Earth Policy Institute (Lester Brown) today announced publication of Plan B 3.0: Mobilizing to Save Civilization:
In setting the carbon reduction goals for Plan B, we did not ask “What do politicians think is politically feasible?” but rather “What do we think is needed to prevent irreversible climate change?” This is not Plan A: business-as-usual. This is Plan B: an all-out response at wartime speed proportionate to the magnitude of the threats facing civilization.
Of particular interest to gardeners and foodies alike is this observation:
We can also reduce carbon emissions by moving down the food chain. The energy used to provide the typical American diet and that used for personal transportation are roughly equal. A plant-based diet requires about one fourth as much energy as a diet rich in red meat. The reduction in carbon emissions in shifting from a red meat–rich diet to a plant-based diet is about the same as that in shifting from a Chevrolet Suburban SUV to a Toyota Prius hybrid car. [emphasis added]
This is not news to me. I learned this 30 years ago, when I first read Frances Moore Lappé's Diet for a Small Planet. But we already know that, as a species, we are not good at putting into action what we already know.

Tomorrow never comes, so we live for today. We will be the cause of our own collapse and extinction. Then the earth will begin to heal from our predations.

Sorry, just not feeling optimistic today.

2007-11-30

Celebrating 50 Years of Carbon Dioxide (Measurement)

Monthly Mean CO2 for the Past 50 Years. Credit: NOAA
Mauna Loa, Hawaii Monthly Mean CO2 for the Past 50 Years

This simple graph of the Mauna Loa Carbon Dioxide Record documents a 0.53 percent or two parts per million per year increase in atmospheric carbon dioxide since 1958. This gas alone is responsible for 63 percent of the warming attributable to all greenhouse gases according to NOAA's Earth System Research Lab.
Fifty years ago the U.S. Weather Bureau, predecessor of NOAA’s National Weather Service, helped sponsor a young scientist from the Scripps Institution of Oceanography to begin tracking carbon dioxide in Earth’s atmosphere at two of the planet’s most remote and pristine sites: the South Pole and the summit of the Mauna Loa volcano in Hawaii. This week NOAA, Scripps, the World Meteorological Organization, and other organizations will celebrate the half-century anniversary of the global record of carbon dioxide in Earth’s atmosphere—often referred to as the “Keeling Curve” in honor of that young scientist, Charles David Keeling.
- NOAA Celebrates 50-Year Carbon Dioxide Record
NOAA's Mauna Loa, Hawaii CO2 Monitoring Station. Credit: NOAANOAA's Mauna Loa, Hawaii CO2 Monitoring Station
Carbon dioxide is the most important of the greenhouse gases produced by humans and very likely responsible for the observed rise in global average temperatures since the mid-20th century. The Mauna Loa and South Pole data were the first to show the rate of CO2 buildup in the atmosphere. In 1974, NOAA began tracking greenhouse gases worldwide and continued global observations as the planet warmed rapidly over the past few decades.

Links

Mauna Loa Carbon Dioxide Record
Mauna Loa Observatories
Earth System Research Lab

2007-11-23

Gardening as if our lives depended on it

2014-10-13: I just discovered that none of the original links are good. Two web sites linked from this post - Climate Choices, and the Northeast Climate Impacts Assessment (NECIA) - now redirect to the Union of Concerned Scientists (UCS).

I first started writing this post in the Fall of 2006. I drafted it in October 2006, but never published it. I think I was too overwhelmed by the impact of what I was writing to release it. The IPCC report has been issued since then. What I wrote over a year ago no longer sounds so alarmist to me. A post on Garden Rant spurred me to dust this off and get it out there, however imperfect I may think it is.

There's a lot to this, and I've gone through some changes just to take it all in. Here's the short version:
  • Climate change is inevitable. It's happening already. We can't undo the damage we've already caused. We can only ride it out.
  • If we continue as we have, the impacts will be severe. It's going to get really, really bad.
  • Actions we take now can reduce the impact. If we start doing things differently now, it won't get as bad as it could. We can affect the future.
There are those who cling, at times violently, to ignorance and dismissal of the facts of climate change induced by human activity. "De-nial ain't just a river in Egypt." It reminds me of the classical stages of grieving described 40 years ago by Dr. Elisabeth KĂĽbler-Ross, all of which are demonstrated in different responses expressed around this topic:
  • Denial. The three-dog argument - denial, minimization, projection - applies here: There's no climate change (it's not a problem). The climate change is within historical ranges (it's not so bad). It's a natural process (it's not my problem).
  • Anger. Protest, boycott, rage against the machine, fight the system, fight the man.
  • Bargaining. Carbon "credits" is the most obvious example. Little different from buying indulgences from a corrupt church.
  • Depression. There's nothing we can do about it.
  • Acceptance. It's going to happen. It's happening. Now what do we do about it?
In July 2006, I wrote about the Bemidji Statement on Seventh Generation Guardianship:
The seventh generation would be my great-grandchildren's great-grandchildren's children. (If I had, or were going to have, any children to begin with.) If a generation occurs within the range of 20-30 years, we're talking 140-210 years. Call it 175 years from now.

It's the year 2181. It's hard for me to imagine anything I can do to stave off or reduce the multiple disasters which we will have caused.
That was the voice of depression. I feel some hope now. The changes I make now, the work I do now, can make a difference. But only if I accept what's going to happen if I do nothing.

2007-02-20

2006 was the fifth-warmest year on record

NASA reports that the five warmest years on record were 2005, 1998, 2002, 2003, and 2006. Put another way, four of the fifth warmest years on record occurred in the last five years. And they expect 2007 to be even warmer than 2006.
The top image is a global map showing temperature anomalies during 2006, blue being the coolest and red being the warmest. Areas with cooler-than-average temperatures appear primarily in the northern Pacific Ocean and Southern Ocean, as well as the interior of Antarctica. The very warmest regions appear in the Arctic and the Antarctic Peninsula, which is consistent with climate predictions that global warming will occur more quickly and dramatically in high latitudes. The red colors that dominate the image reveal the overall warmth of 2006 compared to the long-term average.


The graph below the image tracks mean global temperatures compared to the 1951 to 1980 mean. This graph shows two lines, the 5-year mean, indicated in red, and the annual mean, indicated in pink. Temperatures peaked around 1940 then fell in the 1950s. By the early 1980s, temperatures surpassed those of the 1940s and, despite ups and downs from year to year, they continued rising beyond the year 2000.


- NASA Earth Observatory

2007-02-04

The IPCC Report: Grief & Gardening #6

On Friday in Paris, the International Panel on Climate Change (IPCC) released the first volume, "The Physical Basis of Climate Change," of their Fourth Assessment Report, "Climate Change 2007." The Summary for Policymakers (aka SPM, available in PDF only) presents the synopsis of the findings. Other sections of the full report will be released later this year.

I've been reading the reactions and responses - angry, depressed, pessimistic, or nihilistic - to this report from my favorite garden and nature bloggers.

We are experiencing, and witnessing, grieving on a global scale. We are grieving for the world. And the world is grieving.

I've been processing my own feelings about all of this, and trying to formulate my own response. For now, I don't want to respond directly to the IPCC report, nor others' reactions to it. Here's all I want to share right now.

David Bowie - Five Years Live 1972

2006-11-23

Buying Indulgences: The Carbon Market

My opinion - based on gut reaction, not any deep analysis - of carbon trading is that it's equivalent to the religious practice of buying indulgences: sin all you like, as long as your pockets are deep enough to buy "penance."

It doesn't work. The problem is that carbon, like sin, is itself a very deep pocket. There's no cap on carbon emissions, at least in this country, the single largest contributor. Without a cap, "supply" is unlimited, and no incentive to reduce emissions. There's a perverse dysfunctional incentive to emit more carbon to create more "product" to sell.

Selling indulgences creates a disincentive to reduce sin.
The business of climate change is heating up -- along with the planet -- so fast that many ordinary folks are left wanting to do right but wondering where their money goes. The emerging carbon-offset industry has little oversight or transparency, so it's difficult for consumers to see if they are really being a "hero" by going "zero" -- as Travelocity preaches on its Web site -- or being suckered.

There's no quick and easy way for consumers to see exactly how the money is spent.
...
Just because someone pays to offset a ton of carbon pollution doesn't mean that a ton is taken out of the atmosphere. Also, offsetting a ton of carbon dioxide doesn't even mean that is the gas being offset. Everything is converted to carbon -- meaning that one molecule of methane, a really bad gas -- is equal to 23 molecules of carbon dioxide -- a somewhat bad gas.

- Feel Less Than Green?
via 3rliving, a local business on 5th Avenue in Park Slope which promotes the three Rs: Reduce, Reuse, Recycle.

2006-08-01

News, August 1, 2006: NASA Earth Observatory Maps NYC's Heat Island, Block by Block

Timely enough, given the record temperatures we're experiencing this week. Tomorrow's forecast has been "upgraded" from what I reported yesterday: the THI may reach 117F tomorrow.

Temperatures in New York City as measured by Landsat on August 14, 2002, at 10:30am, during a heat wave. Cooler temperatures are blue, hotter are yellow.
Source: NASA Earth Observatory. Map by Robert Simmon, using data from the Landsat Program.
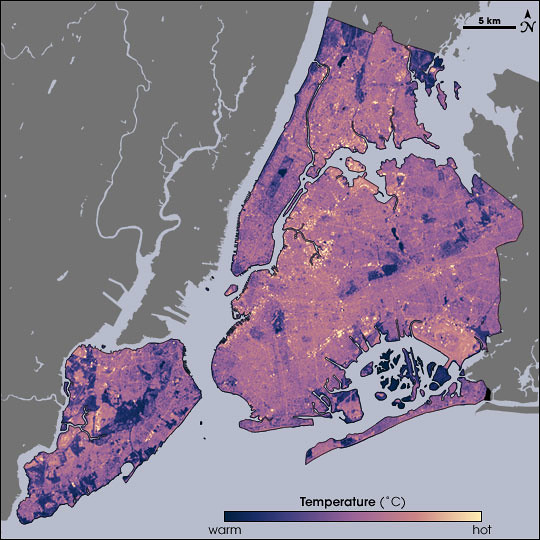
NASA Map of Surface Temperatures in New York City, 2002-08-14

Temperatures in New York City as measured by Landsat on August 14, 2002, at 10:30am, during a heat wave. Cooler temperatures are blue, hotter are yellow.
Source: NASA Earth Observatory. Map by Robert Simmon, using data from the Landsat Program.
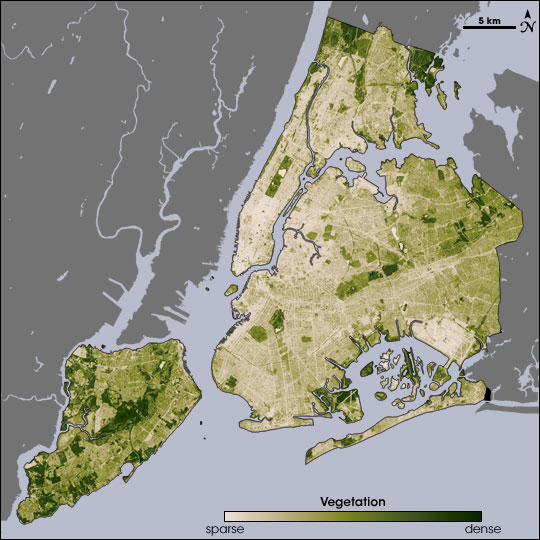
NASA Map of Surface Vegetation in New York City

The ability of vegetation to moderate urban temperatures is graphically demonstrated in these paired images from NASA's Earth Observatory. The spatial resolution of these images is 60 meters per pixel. At that scale, I can just about make out the block where I garden:

Closeup of the vegetation map, centered on central Brooklyn. The green area at the left is Greenwood Cemetery. Prospect Park is the dark green area at the top; the white area within it is Prospect Lake.
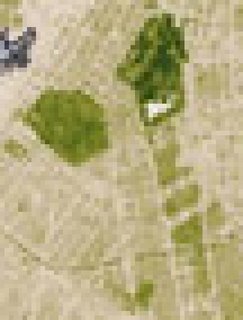

Below the park, to the south, Victorian Flatbush, with its tree-lined streets, detached wood frame houses, and front lawns, spreads out as a series of olive green areas. The beige areas in-between the olive are rowhouses and apartment buildings. You can even make out a curving green line across the southern end of this area: That's the old LIRR right-of-way, long abandoned, and overgrown with trees.

NASA has just published a report on urban heat islands highlighting the research of Stuart Gaffin, an associate research scientist with the Earth Institute at Columbia University in New York City, and his colleagues:

In the summer of 2002, Gaffin and his colleagues used satellite temperature data, city-wide land cover maps, and weather data, along with a regional climate model to identify the best strategies for cooling the city. The team estimated how much cooling the city could achieve by planting trees, replacing dark surfaces with lighter ones, and installing vegetation-covered “green roofs.”
The team studied the city as a whole, as well as six “hotspot” areas—including parts of Manhattan, the Bronx, Queens, and Brooklyn—where air temperatures near the ground were higher than the city-wide average. Each area was serviced by Con Edison, the local power company, so the scientists could compare electricity use. Each area also had available space so that the mitigation strategies the team considered could be modeled in the study and potentially implemented later on.
August 14 fell on one of the hottest heat wave days in New York’s summer of 2002, making it a good day to take the city’s temperature. Measuring the temperature of every last sidewalk, street, parking lot, roof, garden, and grassy area in an entire city isn’t easily done from the ground, so the researchers relied on NASA to take the city’s temperature from the sky. NASA’s Landsat Enhanced Thematic Mapper collected thermal infrared satellite data. ...
- Beating the Heat in the World's Big Cities

Related posts

Urban Forestry